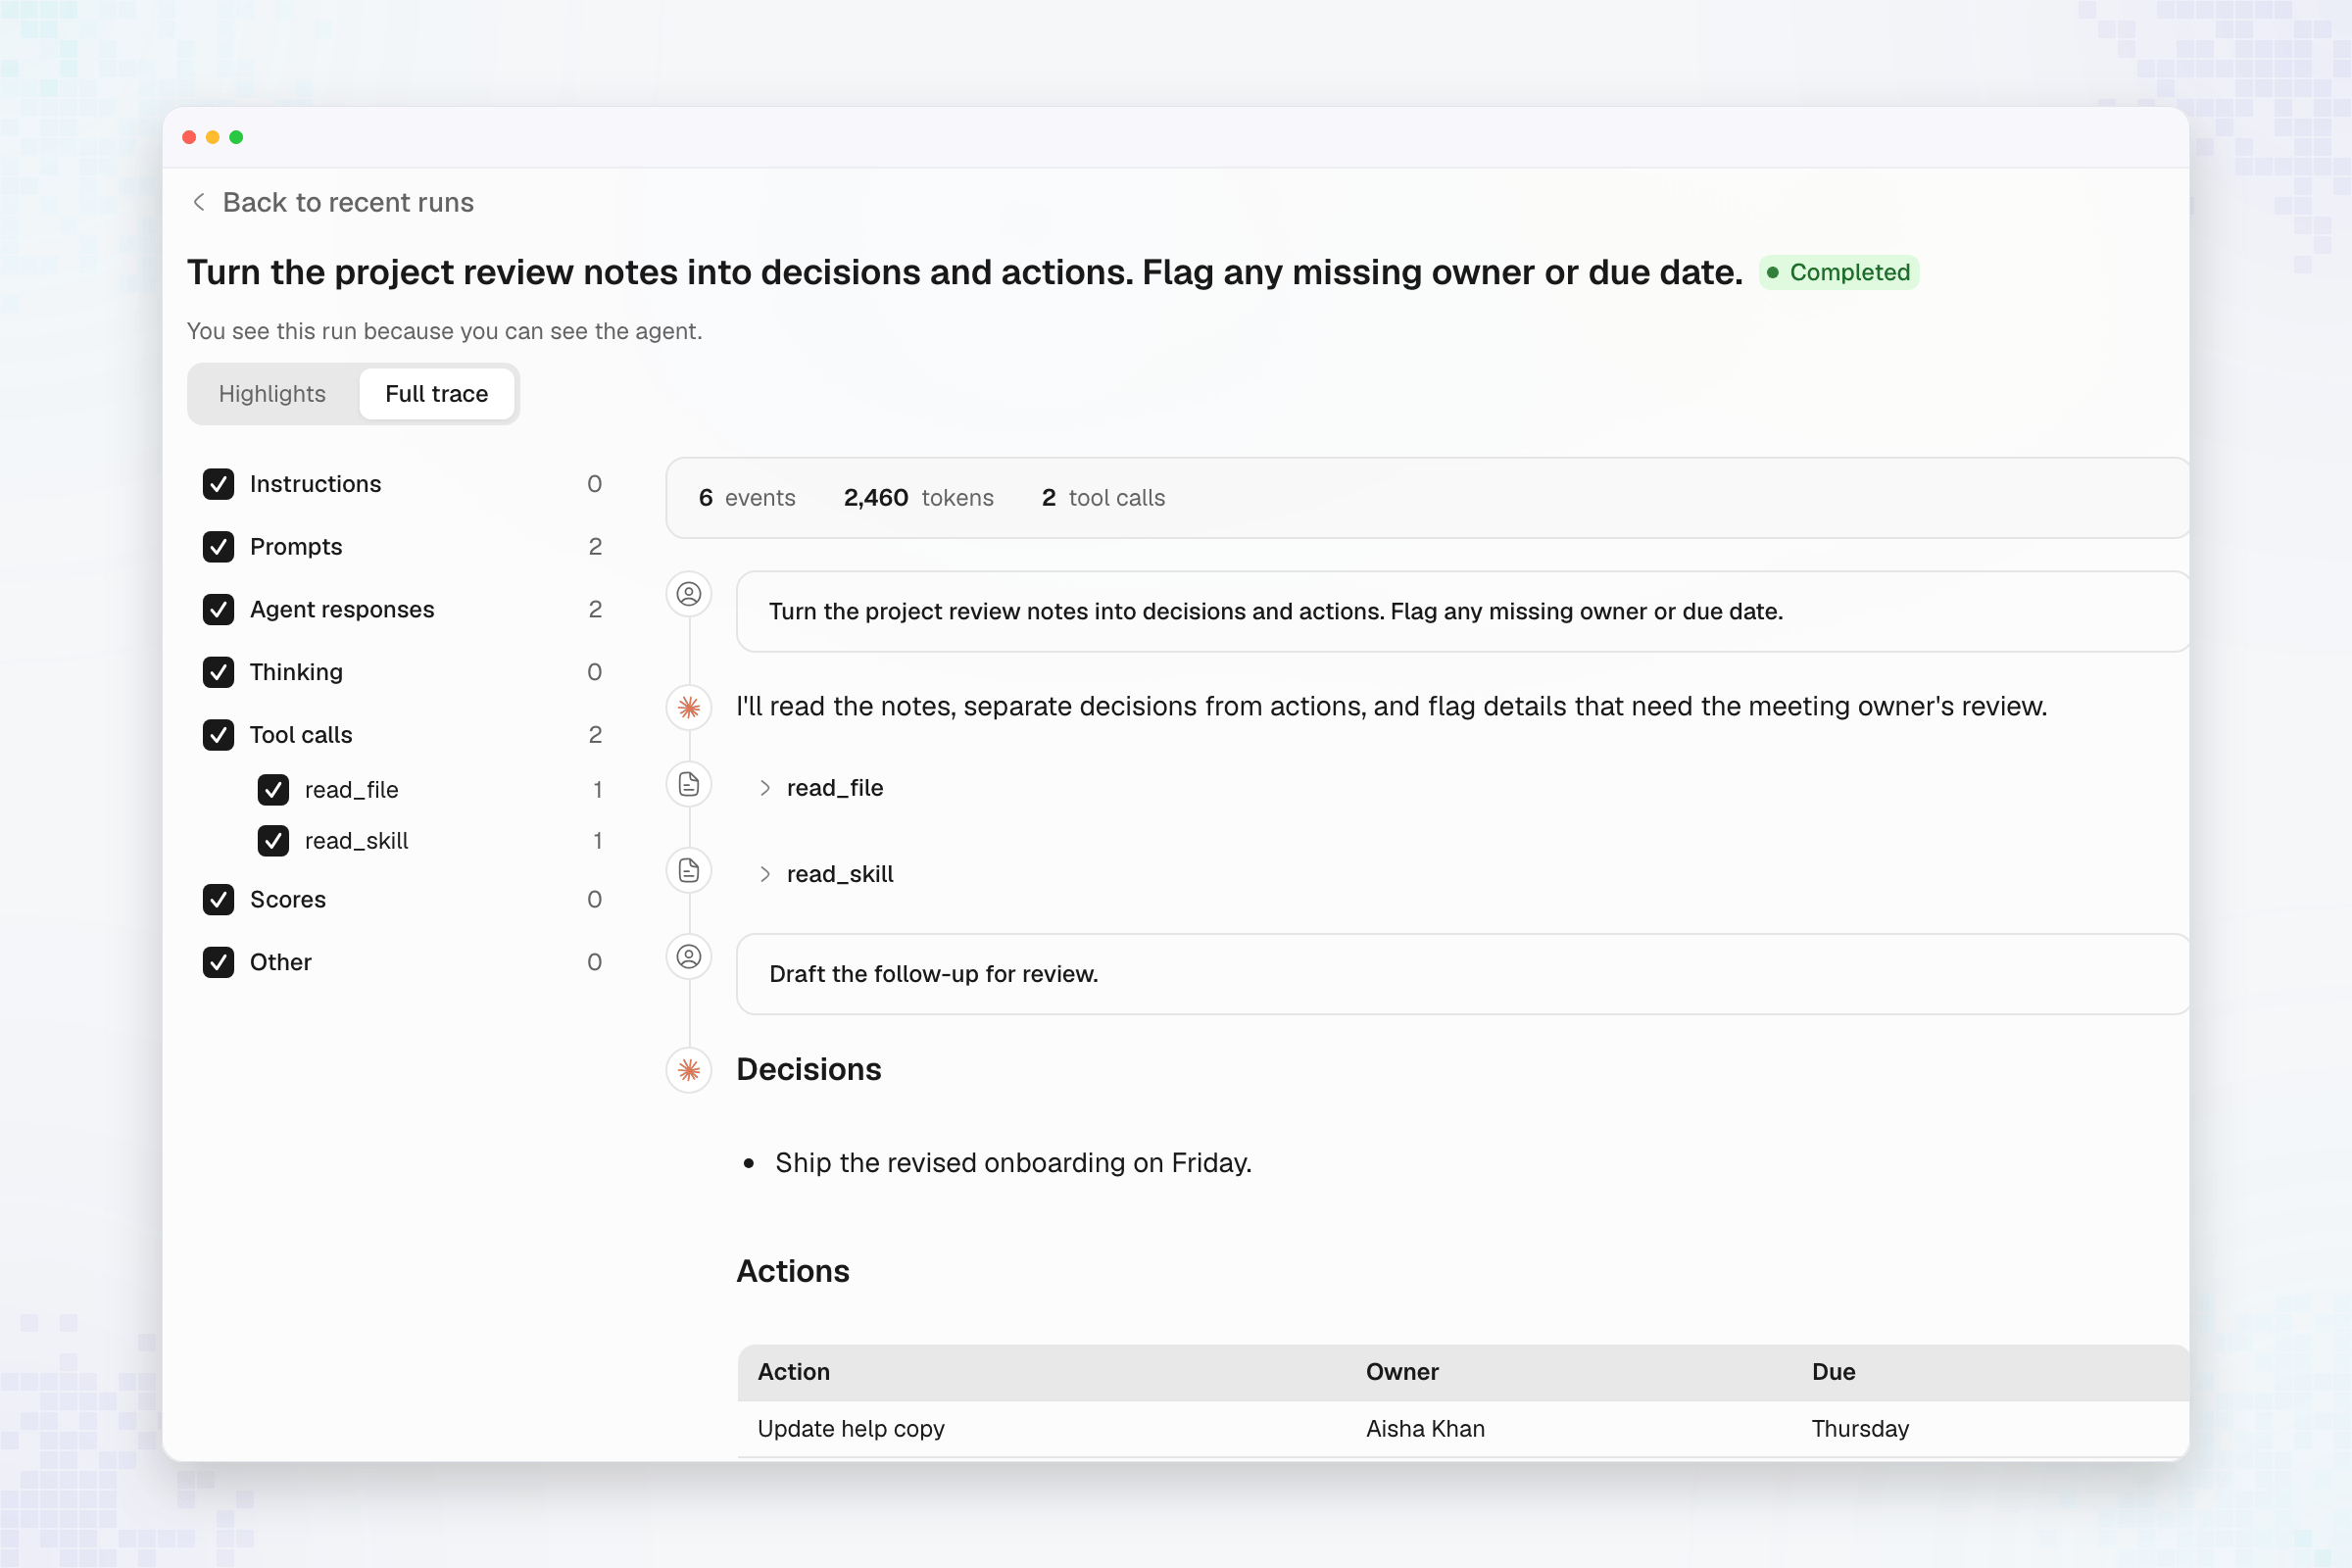
Use a run’s trace to find the step behind a failure, slow response, or cost increase. You need access to the agent and the workspace containing its execution data. Full trace with prompt, response, and tool-call filters beside a completed run

Find the run

  1. Open the agent’s profile and select Usage.
  2. Choose the period that contains the run.
  3. In Recent runs, select a trace. Select Load more to read earlier runs in the period.
If you know the session instead, start from Sessions and open the run recorded for it. To find an agent across the fleet, start from Agent usage.

Read the evidence

  1. Read Highlights for the opening prompt, key decisions, errors, and closing response.
  2. Select Full trace to inspect every recorded step.
  3. Use the event category filters to narrow the timeline. Under tool calls, choose individual tools when you need to follow one dependency.
  4. Select Clear filters to restore the complete view.
The filters change what the timeline displays. They do not change the stored trace. When the available trace is partial or limited to an agent or skill, the view explains that limit.

Follow the symptom

A span error is an execution failure. An answer that contains no span errors can still fail your quality rubric; add an eval case when the failure should be checked again.

If the run is missing

Check the selected workspace and time range, then verify the sending identity. A personal API key attributes the trace to that person even when the application sets an agent name. See Trace errors.