

Before you begin
Before you start, make sure you have:- Permission to manage organization settings: Usually the Admin role. Reports does not appear in the app rail for other members.
- Traced agents: Agents whose runs are sent with their own API keys. See Send and verify traces.
1
Open Agent usage
Select Reports in the app rail, then Agent usage, and choose the workspace scope and period.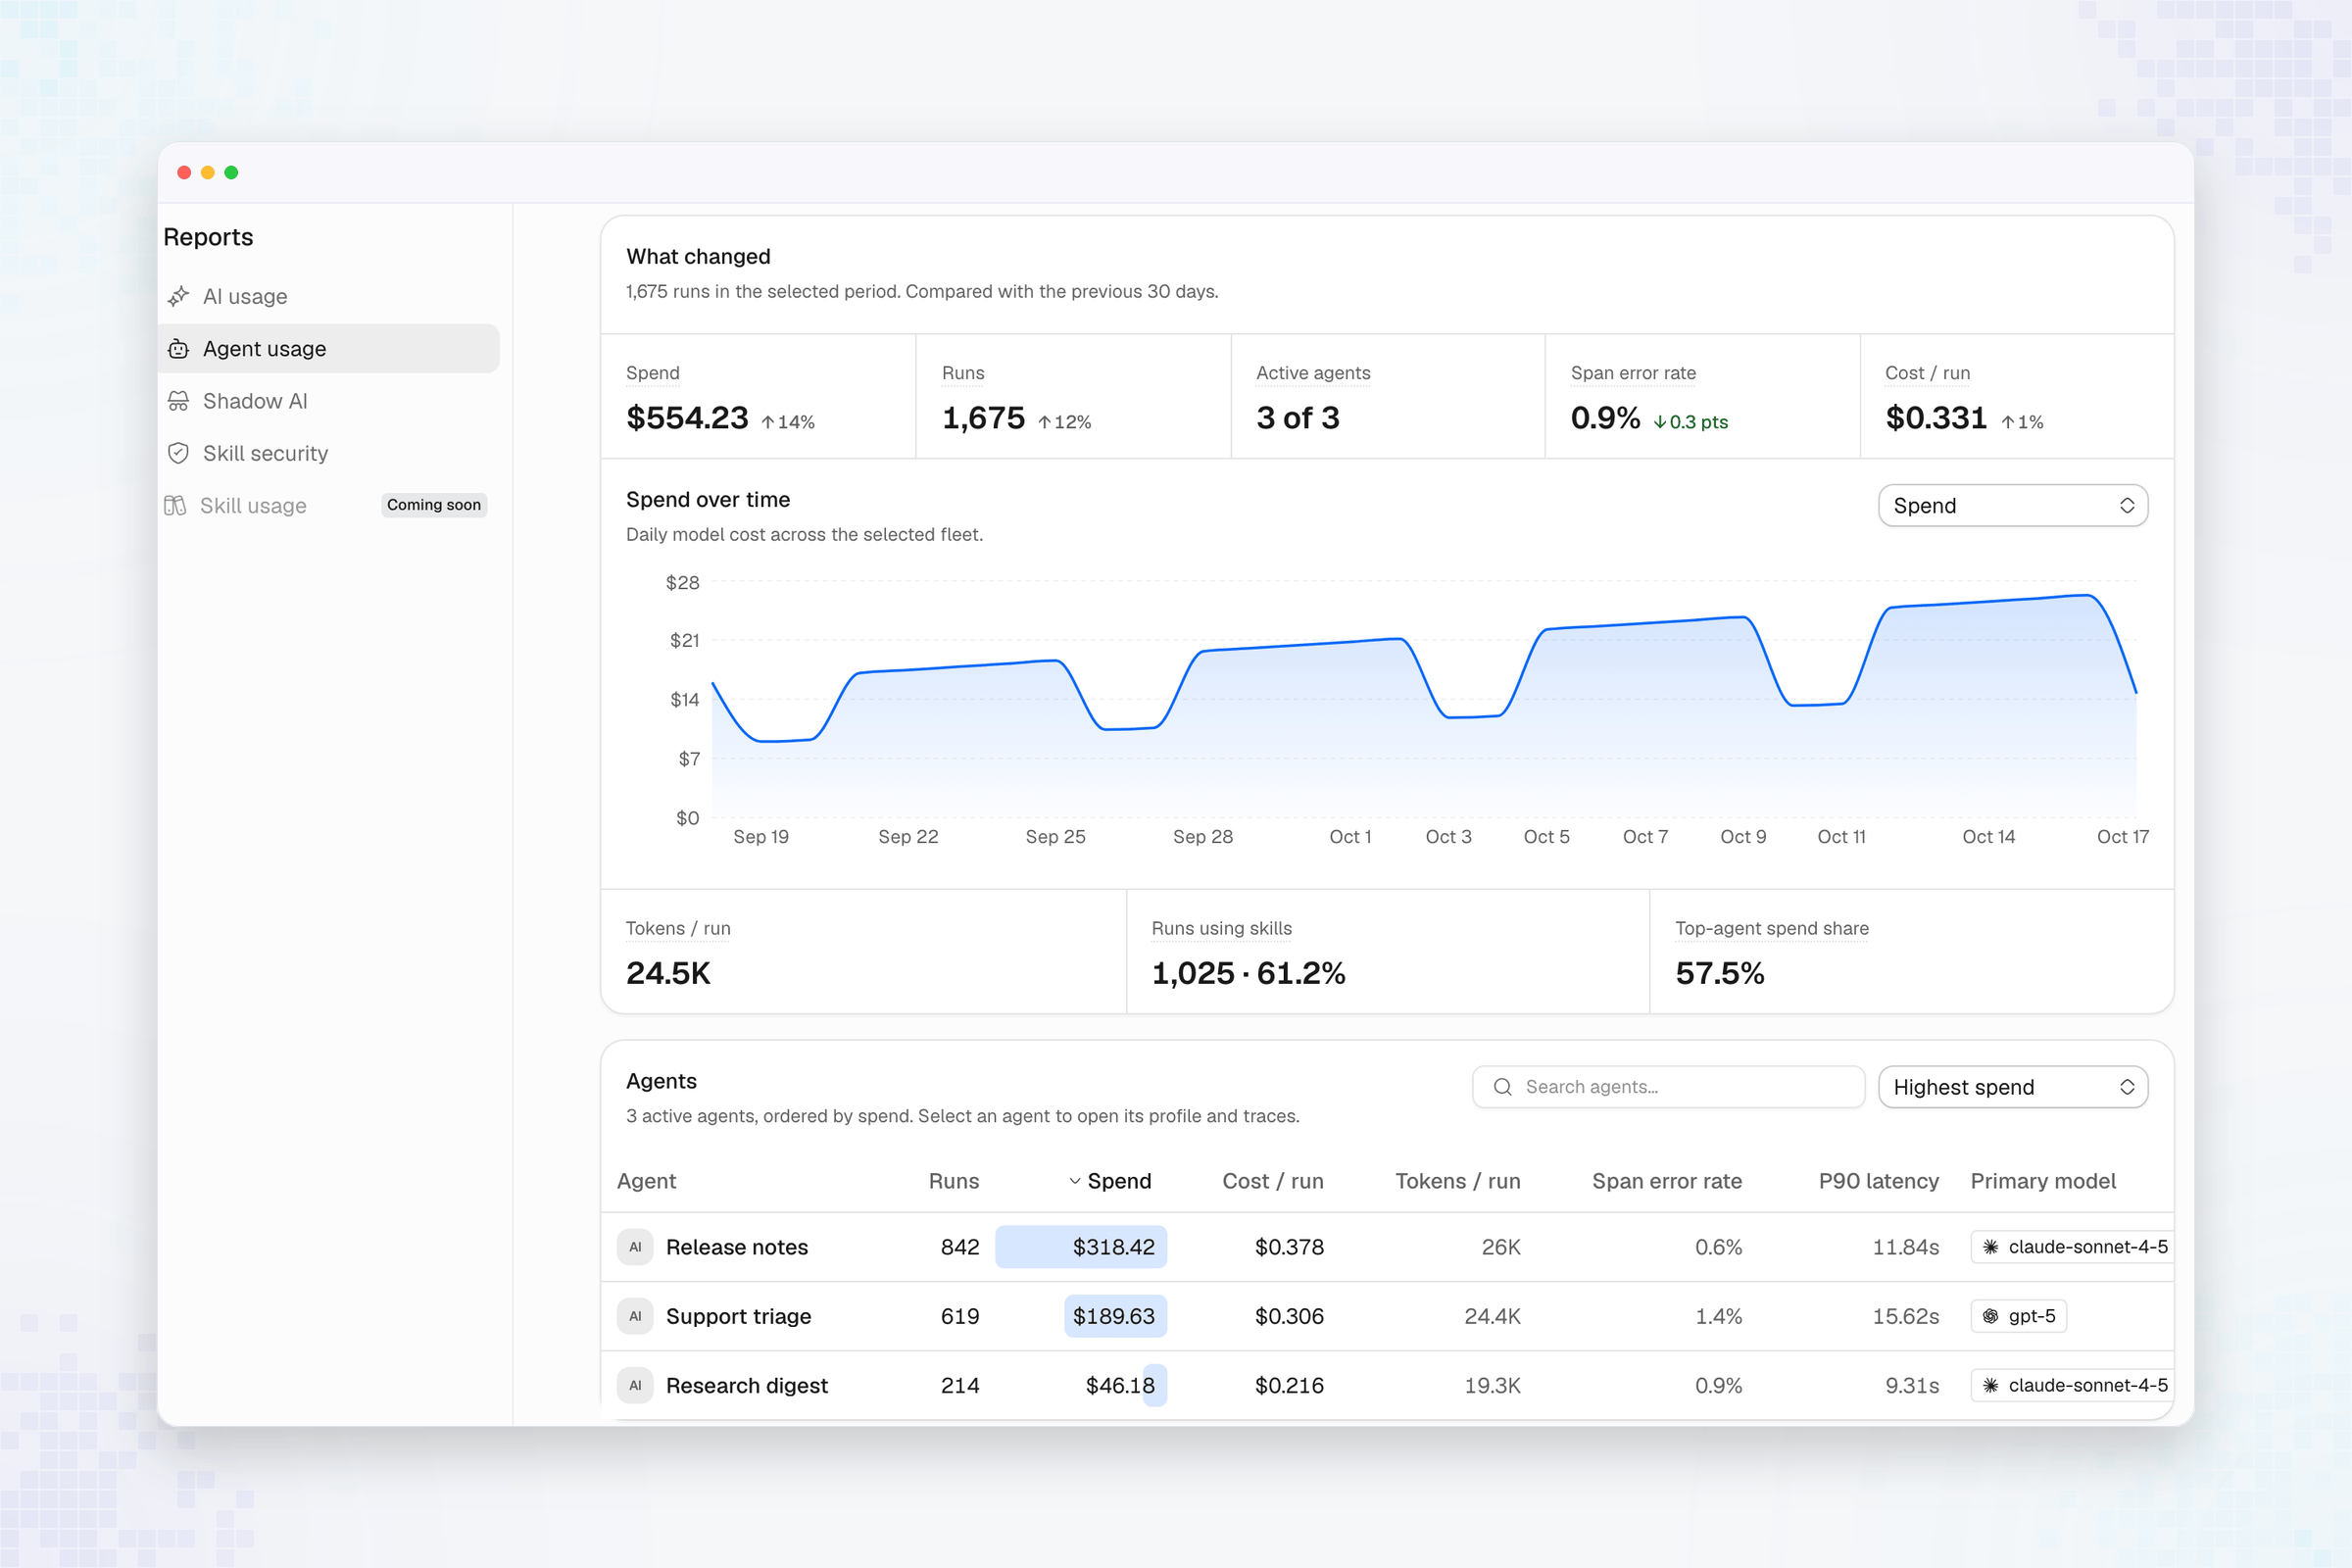
2
Read fleet summary
What changed leads with the period’s token total, compared with the period before it, then shows spend, runs, active agents, span error rate, and cost per run for the period, each with its change from the previous one. Hovering Agent runs or Spend shows the measure day by day for the period, with what it covers; the card opens on keyboard focus too. Hovering Runs using skills opens a different card: it states how many of the period’s runs used a skill, with a Used a skill and No skill bar and each group’s count and share of all runs. Read it before comparing agents. When the tiles show their trend lines, a small legend beside the heading names the window they cover, such as Last 30 days.Switch the trend chart between Spend, Tokens, Runs, Cost / run, Tokens / run, and Span error rate. On a day-by-day chart with at least two days of data, Spend and Tokens stack each day’s total by the period’s top models, ranked by the metric shown, with the remainder as Other. Up to seven models are named, and the legend below the chart lists them, with Other drawn only when the remainder is not zero.The trend ends at the last whole day: a day still in progress is drawn only when the chart would otherwise hold fewer than three points, so on a two-day chart today appears. Totals elsewhere in the report, including What changed, still include today. The chart names day and week buckets in UTC: west of UTC, the day still in progress can read a day ahead of your local date.
3
Find agent that needs attention
Sort the agent table by spend, run count, cost per run, tokens per run, span error rate, or P90 latency, or search by name. Select a row to open the agent’s profile and inspect its Usage and recent runs.
4
See who agents ran for
The Visitors section shows who the fleet’s runs were for: the distinct people and calling agents named on runs by Identify visitors. Read the four figures — Visitors, Runs for visitors, Returning (visitors also present in the previous period), and Agents with visitors — then the cards below them: By agent, which agents ran for the most visitors, and Top visitors, which visitors got the most runs. Names come from the visitor directory; a visitor it has no row for shows by its handle.Filter the section with the Show control: Humans and agents, Humans, or Calling agents.If no run in the period named a visitor, the section shows a setup card instead of figures, with a prompt to copy into a coding agent opened in the busiest agent’s repository. The prompt walks through Identify visitors. A figure can also show as unavailable when the visitor directory or the period’s breakdown could not be fully read; a very long period can be incomplete, and a shorter one fixes it.See How trace attribution works for how a visitor attaches to a run.
5
Read the breakdown cards
The report also has six cards that break the period down: Model mix, spend, tokens, and cache efficiency for the six highest-spend models; Prompt cache, how much model input was reused instead of processed again; Tool performance, calls, fleet share, and recorded step errors for the six most-used tools; Top skills, invocation volume and share for the six most-used published skills; AI tool performance, run volume, spend, efficiency, and recorded errors by serving runtime; and Latency outliers, P50, P90, and tail gap for the six slowest agents. Human waits can be intentional.Each card’s title row shows a count of what the card covers and the number of days in the period, such as 6 models · 7 days on Model mix. A count that could not be read shows as a dash, not a zero.
6
Verify figures before acting
- Span error rate counts spans recorded as errors. It does not measure response quality.
- Cost / run and Tokens / run are period averages. Compare them with run volume before treating a change as a trend.
- of all runs used skills is the share of runs with recorded skill use. Hovering the tile shows both counts — runs that used a skill and runs that did not — with their shares. A missing value means the breakdown could not be established.
- A value marked unavailable could not be read; the report never turns it into a zero.
Troubleshooting
If an agent you run is missing from the report, its runs were probably sent with a personal API key. See Traces appear under person instead of agent.Next steps
- Investigate agent cost: Follow a spend increase through tokens, cache use, and model rates.
See also
- How trace inspection works: Drill from an agent into one run.
- Track usage and audit tool calls: MCP usage and MCP activity.
- How skill security scans work: What the Skill security report summarizes.
- How repository profiles work: What one repository’s profile shows.