

Agents usage
Use Agents usage to compare agents that produced recorded runs in the selected period. It starts with the fleet summary, then lists the agents that contributed to it.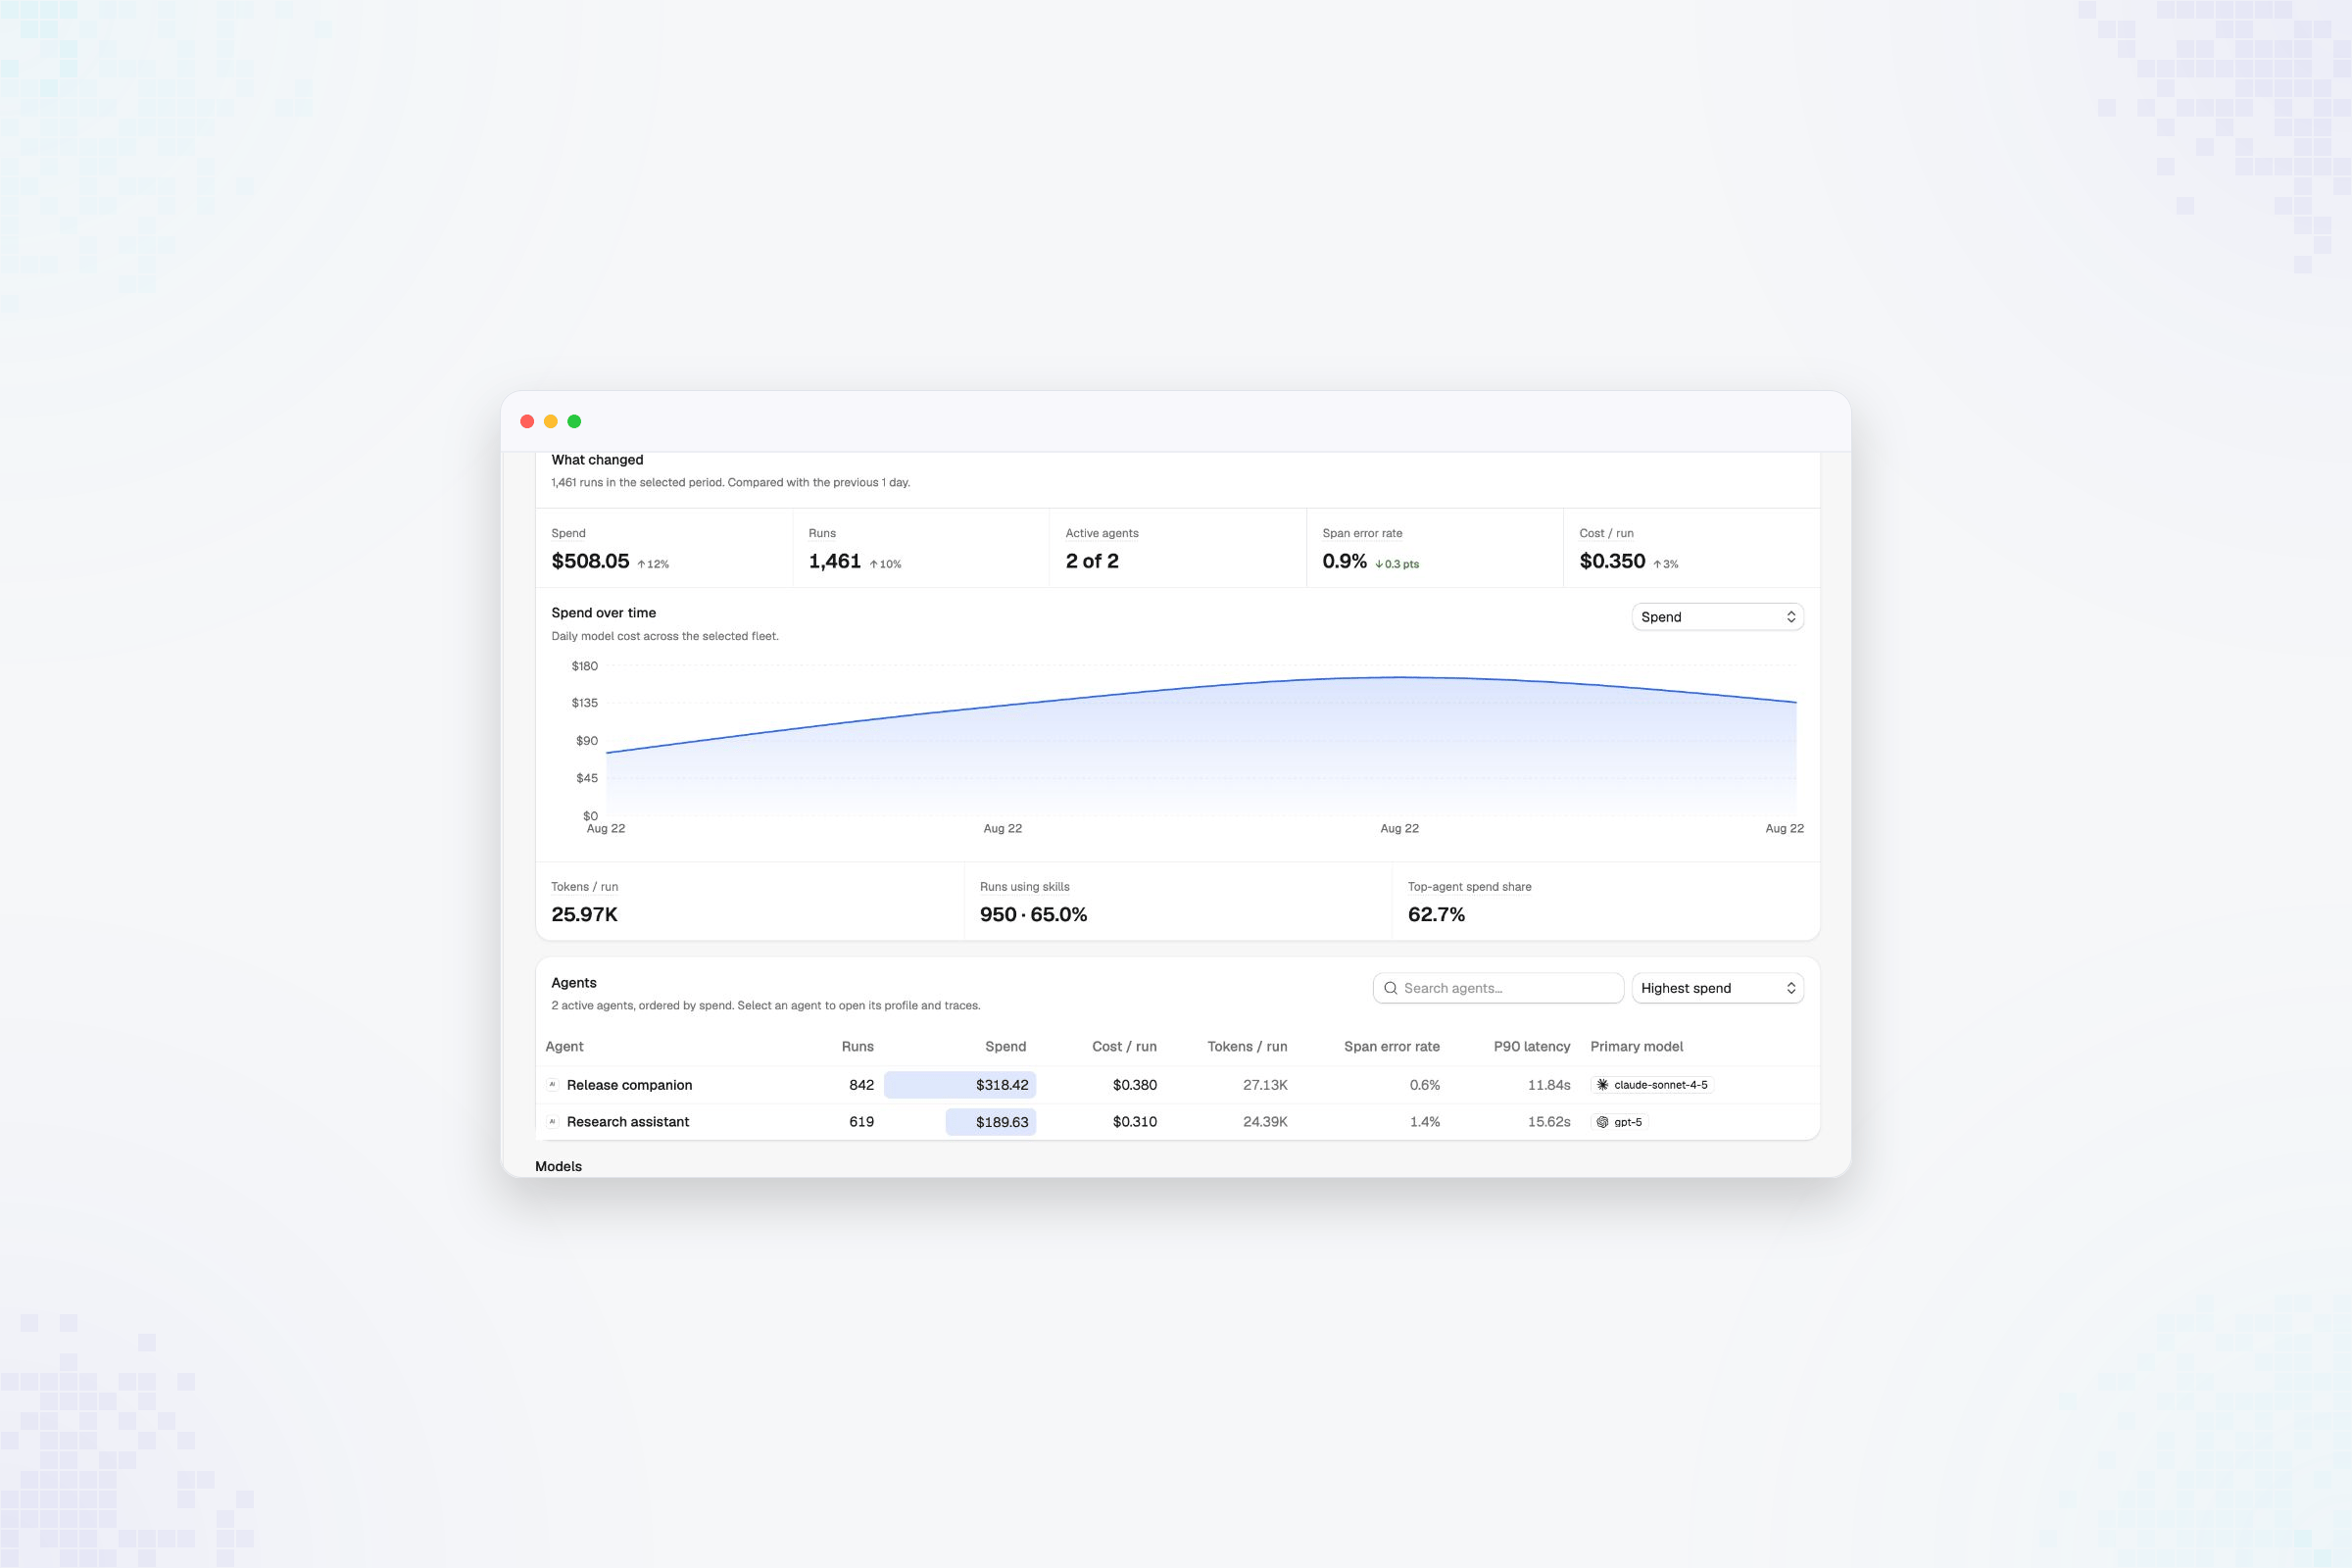
Review the fleet
- Expand Reporting in the sidebar.
- Select Agents usage.
- Read What changed before comparing individual agents. It shows spend, runs, active agents, recorded span error rate, and cost per run for the selected period.
- Use the trend control to switch the chart between cost, tokens, runs, efficiency, and recorded error rate.
Find an agent that needs attention
Use the agent table to sort by spend, runs, cost per run, tokens per run, recorded error rate, or P90 latency. Search by name when you already know the agent. Select a row to open that agent’s profile and inspect its usage and recent runs.Read the metrics carefully
- Span error rate measures recorded spans marked as errors. It does not measure response quality.
- Cost per run and tokens per run are period averages. Compare them with run volume before treating a change as a trend.
- Runs using skills counts runs with recorded skill use. A missing value means the report could not establish the breakdown.
AI usage is a separate report. Skill usage remains Coming soon in the
reporting navigation; it is not an alternate view of Agents usage.